A play by play
Skillz Data Visualization Typography
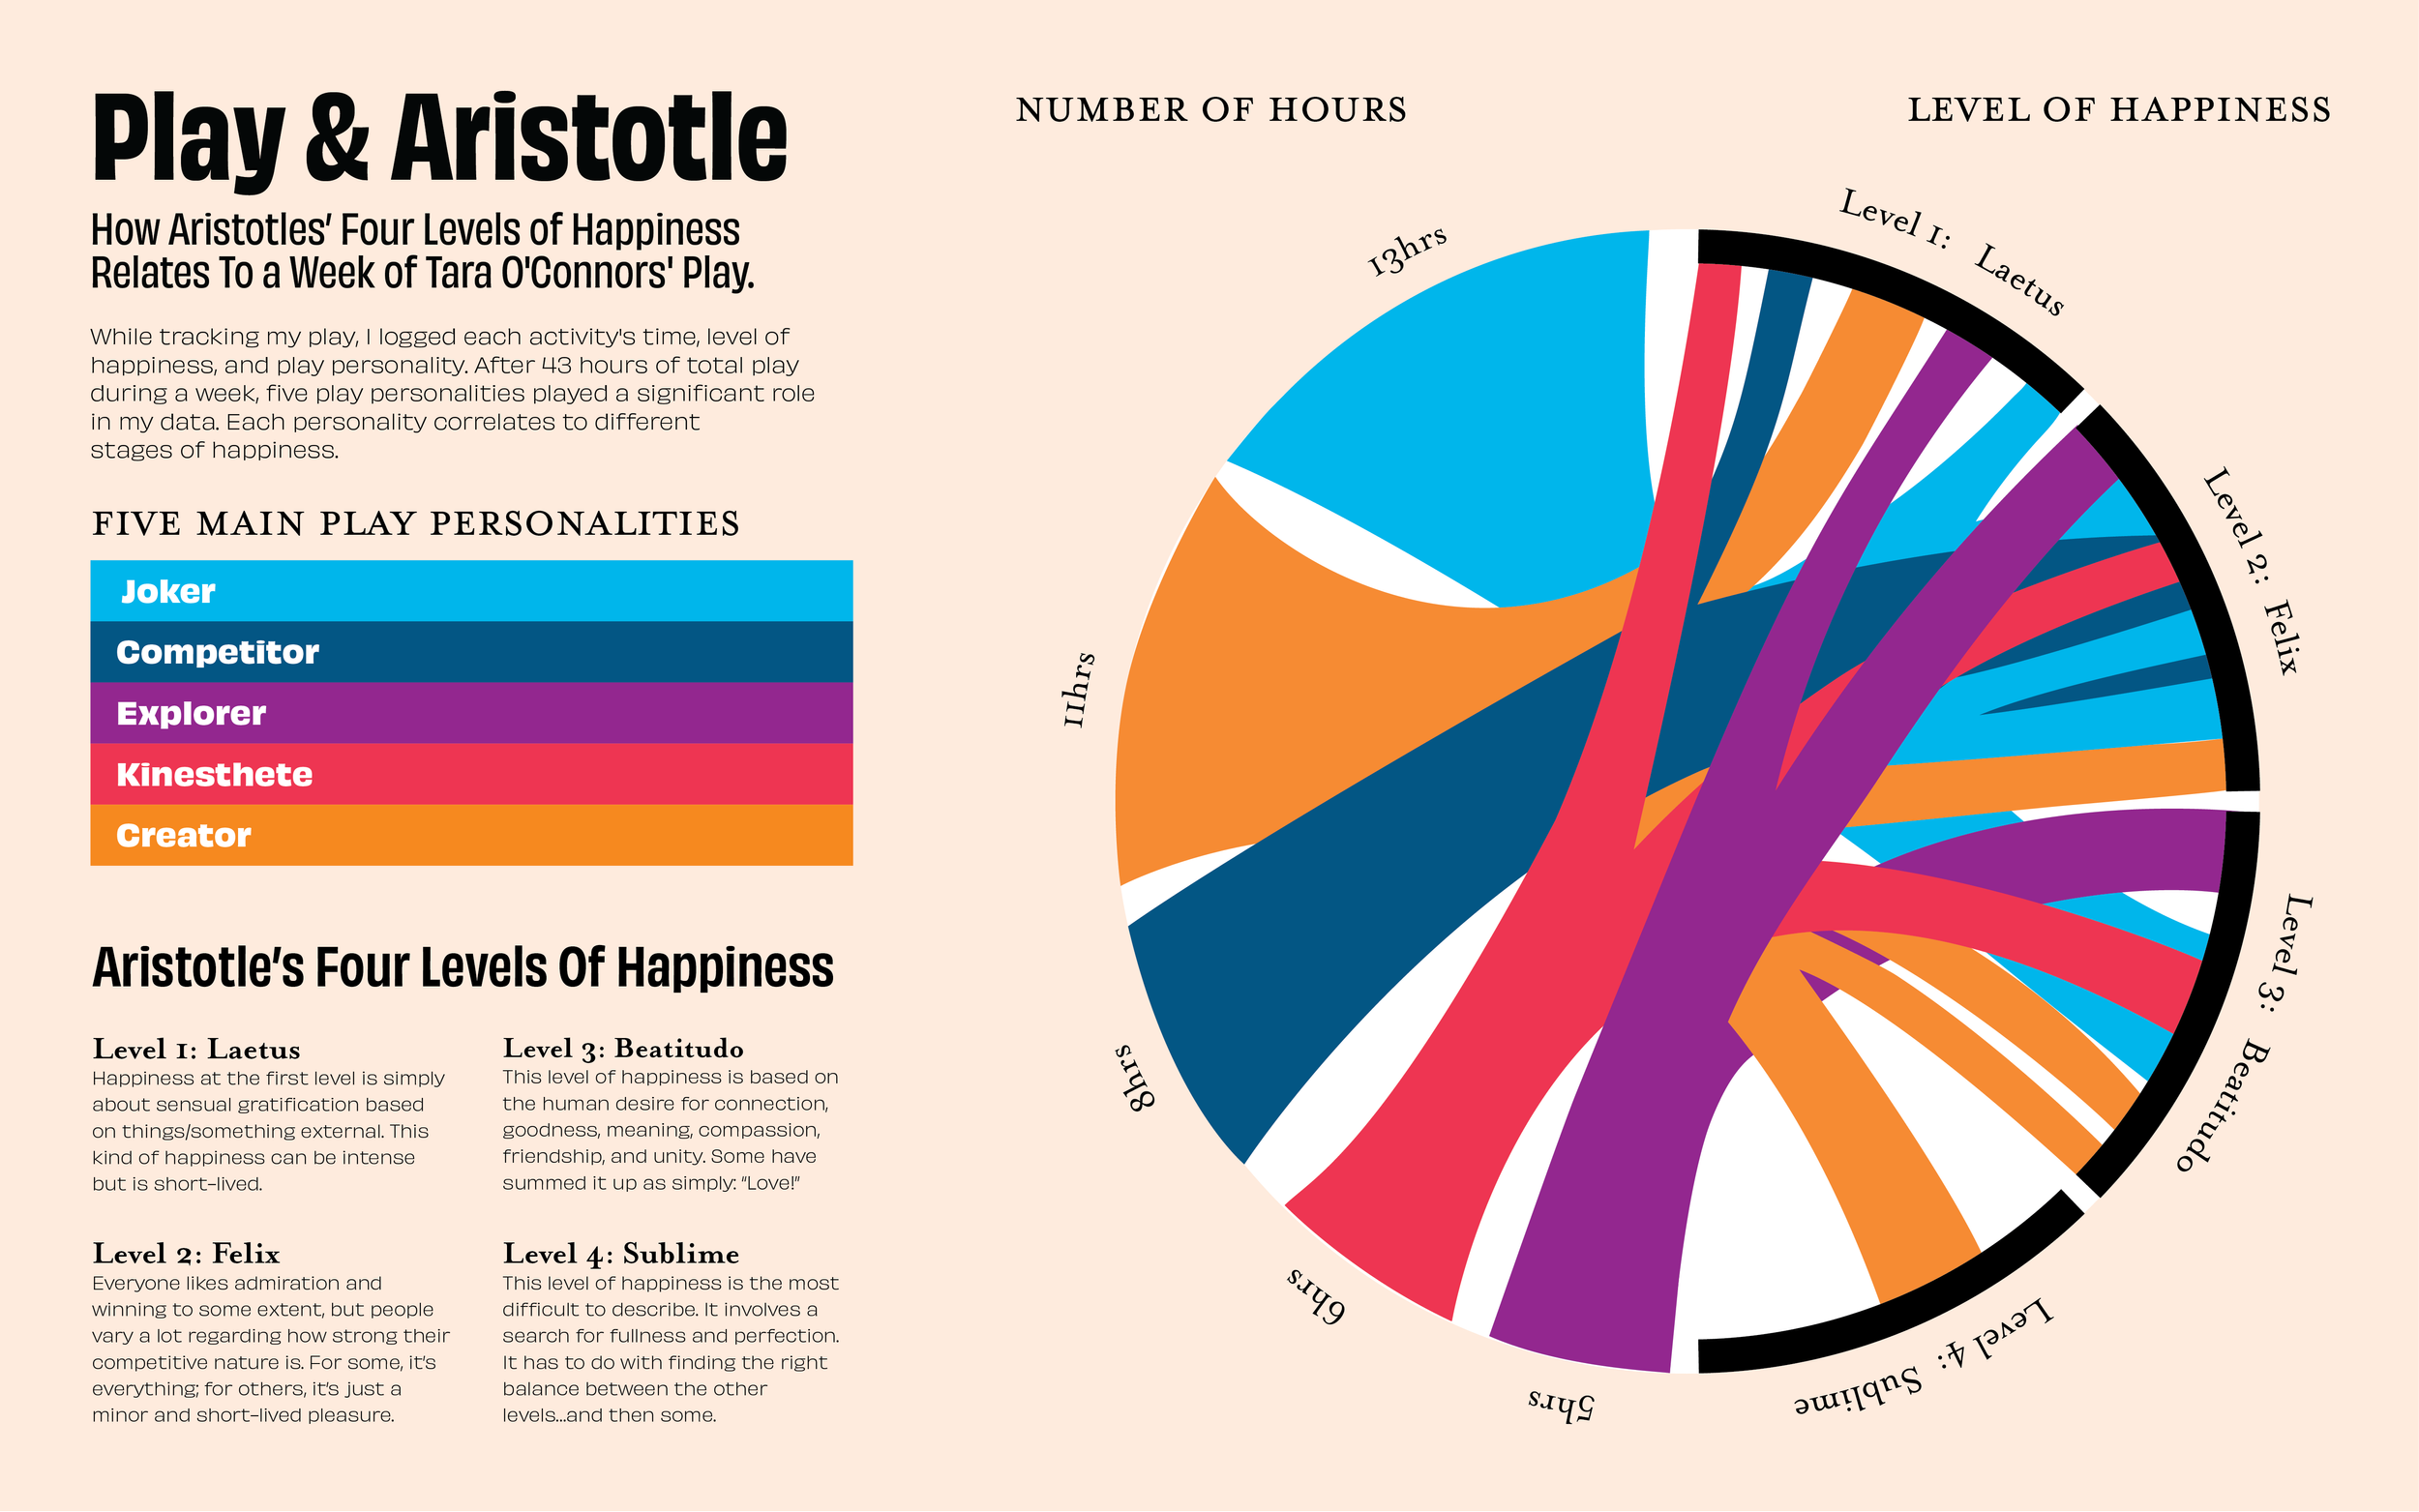
Play isn’t just for kids—it shapes how we think, feel, and connect, even as adults. Whether intentional or not, play shows up in our daily lives and has the power to positively impact our well-being.
To explore this, I tracked my own play over the course of a week and visualized the data through three lenses: duration, play personality, and Aristotle’s levels of happiness. The result is a playful yet insightful infographic that captures the joy and complexity of everyday play.